A Reverse-Engineering Example With GDB and Iaito/Radare2
2026-05-27T23:56:34+08:00
Over the past several weeks I have been learning reverse engineering, and I have written a blog post to share my very first experience. Lately, I have been diving a little deeper, solving a CTF challenge using a combination of static analysis and dynamic analysis, and I found it to be a great example for explaining reverse engineering in a bit more depth.
I had previously planned to write an article about dynamic analysis with GDB. However, I found that this challenge was also a great example for explaining GDB. To solve this challenge, I will also use another tool, iaito, which is the graphical front-end of radare2.
The challenge
cIMG is a kind of image format used to represent an image made up of characters in different colours in the terminal. It consists of:
- the magic number, which is
cIMG; - the version number;
- the width and height;
- the data, with each pixel containing R, G, B, and the ASCII character.
This challenge is about feeding a cIMG file to an executable that will give you the flag only if the cIMG meets certain conditions.
The source code
Obtain the source of the challenge here. This source code seems to be licensed under the BSD 2-Clause Licence.
Compile it using GCC:
$ gcc -O3 challenge.c -o challenge
Open Python and create an example cIMG file:
$ python3
Python 3.13.5 (main, Jun 25 2025, 18:55:22) [GCC 14.2.0] on linux
Type "help", "copyright", "credits" or "license" for more information.
>>> with open("example.cimg", "wb") as file:
...     file.write(b"cIMG\x02\0\x0a\x0a")
...     file.write(b"\x50"*(10*10*4))
...
8
400
Use the challenge binary to open the example cIMG file:
user@learnaarch64asm:~$ ./challenge ./example.cimg
PPPPPPPPPP
PPPPPPPPPP
PPPPPPPPPP
PPPPPPPPPP
PPPPPPPPPP
PPPPPPPPPP
PPPPPPPPPP
PPPPPPPPPP
PPPPPPPPPP
PPPPPPPPPP
This file prints, but it does not give us the flag.
Static analysis
We need to make up a cIMG file that gives the flag. Let’s do a static analysis first.
Open the file in iaito. Perform an aaa analysis and open the graph of the main function. You will get:
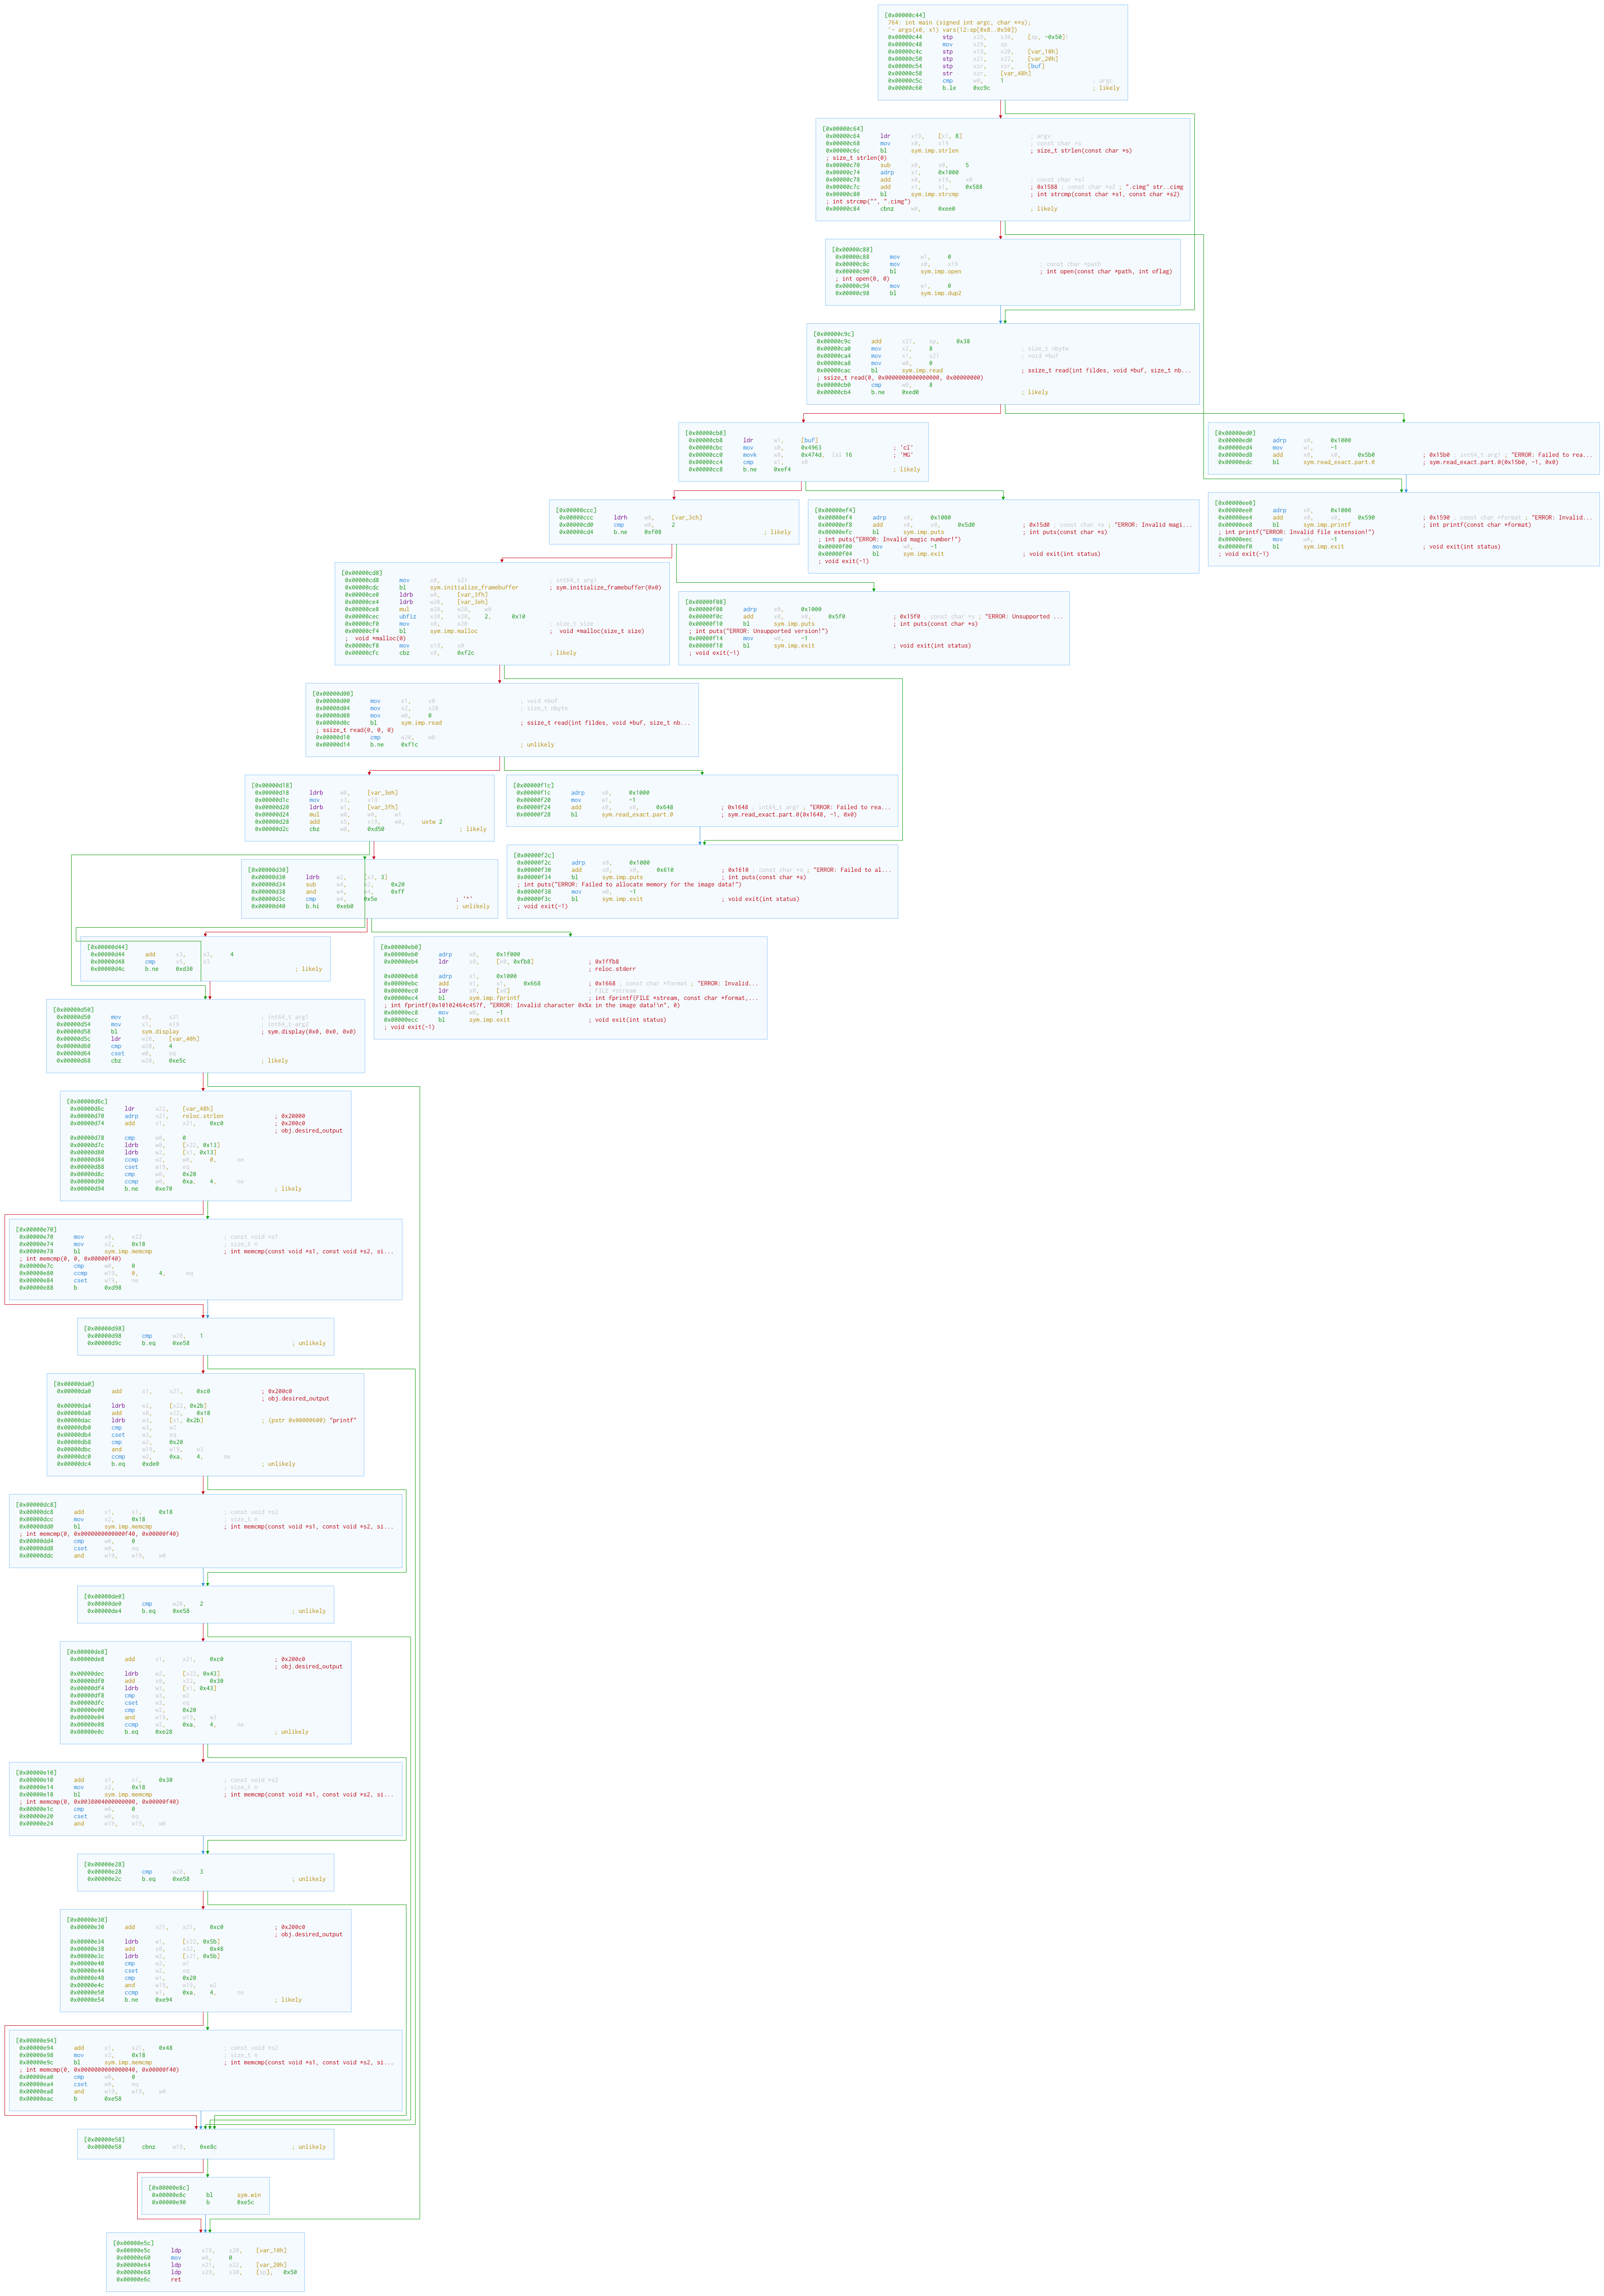
We can find the file header read at 0x00000cac, the magic number check at 0x00000cc4, the version check at 0x00000cd0, and the width/height read at 0x00000ce0. Then it uses malloc to allocate a piece of memory for the image data, and reads the data into that memory.
The magic number is cIMG; its bytes are 63 49 4d 47 in hex. The version is a 32-bit little-endian integer; both the height and the width are 8-bit integers.
Flag condition
Let’s head to the end of the function. Obviously, sym.win is the function that will give us the flag. It is called at 0x00000e8c, and this is executed after a check at 0x00000e58. This check requires w19 not to be zero.
Tampering with the control flow
It is time to fire up GDB.
$ gdb --args ./challenge ./example.cimg
GNU gdb (Debian 16.3-1) 16.3
Copyright (C) 2024 Free Software Foundation, Inc.
License GPLv3+ or later <http://gnu.org/licenses/gpl.html>
This is free software: you are free to change and redistribute it.
There is NO WARRANTY, to the extent permitted by law.
Type "show copying" and "show warranty" for details.
This GDB was configured as "aarch64-linux-gnu".
Type "show configuration" for configuration details.
For bug reporting instructions, please see:
<https://www.gnu.org/software/gdb/bugs/>.
Find the GDB manual and other documentation resources online at:
    <http://www.gnu.org/software/gdb/documentation/>.

For help, type "help".
Type "apropos word" to search for commands related to "word"...
Reading symbols from ./challenge...
(No debugging symbols found in ./challenge)
Break at the main function and start the programme:
(gdb) break *main
Breakpoint 1 at 0xc44
(gdb) run
Starting program: /home/user/challenge ./example.cimg
[Thread debugging using libthread_db enabled]
Using host libthread_db library "/lib/aarch64-linux-gnu/libthread_db.so.1".

Breakpoint 1, 0x0000aaaaaaaa0c44 in main ()
We note that GDB’s data addresses have an offset of 0xaaaaaaaa0000.
Break just before the flag-condition check and continue:
(gdb) break *0x0000aaaaaaaa0e58
Breakpoint 2 at 0xaaaaaaaa0e58
(gdb) continue
Continuing.
PPPPPPPPPP
PPPPPPPPPP
PPPPPPPPPP
PPPPPPPPPP
PPPPPPPPPP
PPPPPPPPPP
PPPPPPPPPP
PPPPPPPPPP
PPPPPPPPPP
PPPPPPPPPP

Breakpoint 2, 0x0000aaaaaaaa0e58 in main ()
Alter the content of the register w19 and continue:
(gdb) set $w19 = 1
(gdb) continue
Then the executable will give us the flag. Now the task is finished, and have a good day :-p
Just kidding. If we really concluded the challenge this way, the joy of RE would be gone. Let’s dive deeper.
Data check
Go back to iaito. Click w19 in the graph. This will highlight that register in all instructions in the graph. Scroll the graph backwards to find a clue.
We can see some calls to sym.imp.memcmp in the graph.
memcmp is a standard C library function declared in <string.h> that compares two blocks of memory byte by byte:
int memcmp(const void *ptr1, const void *ptr2, size_t n);
ptr1 and ptr2 point to the two blocks respectively, and n specifies the byte count to compare. If the two blocks are identical, the function returns 0; otherwise, it returns a non-zero number.
There are four memcmp calls. Each call is followed by cmp w0, 0. Except for the first call, there is also a cset w0, eq and an and w19, w19, w0 after cmp. We can conclude that if memcmp finds a difference, w19 will be cleared, since w0 will be zero. Therefore, we guess that we need to make the four pairs of memory blocks the same.
x0 and x1 are the two addresses to compare. x2 contains the size; mov x2, 0x18 tells us the size is 24 bytes.
Open GDB again and inspect the memory before the first memcmp:
(gdb) break *0x0000aaaaaaaa0e78
Breakpoint 1 at 0xaaaaaaaa0e78
(gdb) run
Starting program: /home/user/challenge ./example.cimg
[Thread debugging using libthread_db library "/lib/aarch64-linux-gnu/libthread_db.so.1].
PPPPPPPPPP
PPPPPPPPPP
PPPPPPPPPP
PPPPPPPPPP
PPPPPPPPPP
PPPPPPPPPP
PPPPPPPPPP
PPPPPPPPPP
PPPPPPPPPP
PPPPPPPPPP

Breakpoint 1, 0x0000aaaaaaaa0e78 in main ()
(gdb) info registers x0 x1
x0             0xaaaaaaac12a0      187649984565920
x1             0xaaaaaaac00c0      187649984561344
(gdb) x/24xb $x0
0xaaaaaaac12a0: 0x1b    0x5b    0x33    0x38    0x3b    0x32    0x3b    0x30
0xaaaaaaac12a8: 0x38    0x30    0x3b    0x30    0x38    0x30    0x3b    0x30
0xaaaaaaac12b0: 0x38    0x30    0x6d    0x50    0x1b    0x5b    0x30    0x6d
(gdb) x/24xb $x1
0xaaaaaaac00c0 <desired_output>:        0x1b    0x5b    0x33    0x38    0x3b   0x32     0x3b    0x32
0xaaaaaaac00c8 <desired_output+8>:      0x33    0x31    0x3b    0x30    0x31   0x37     0x3b    0x31
0xaaaaaaac00d0 <desired_output+16>:     0x33    0x30    0x6d    0x63    0x1b   0x5b     0x30    0x6d
Random bytes. I cannot figure out what they mean.
Go back to iaito. The first piece of memory is loaded from x22, and x22 is loaded from the address var_48h. afv tells us it is 0x48 from sp:
[0x00000e70]> afv
arg signed int argc @ x0
arg char ** s @ x1
var int64_t var_50h @ sp+0x0
var int64_t var_50h_2 @ sp+0x8
var int64_t var_10h @ sp+0x10
var int64_t var_10h_2 @ sp+0x18
var int64_t var_20h @ sp+0x20
var int64_t var_20h_2 @ sp+0x28
var void * buf @ sp+0x38
var int64_t var_3ch @ sp+0x3c
var int64_t var_3eh @ sp+0x3e
var int64_t var_3fh @ sp+0x3f
var int64_t var_40h @ sp+0x40
var int64_t var_48h @ sp+0x48
Restart GDB and skip the function prologue after main is invoked:
(gdb) break *main
Breakpoint 1 at 0xaaaaaaaa0c44
(gdb) run
Starting program: /home/user/challenge ./example.cimg
[Thread debugging using libthread_db library "/lib/aarch64-linux-gnu/libthread_db.so.1].

Breakpoint 1, 0x0000aaaaaaaa0c44 in main ()
(gdb) si
0x0000aaaaaaaa0c48 in main ()
(gdb) si
0x0000aaaaaaaa0c4c in main ()
Check the value of the stack pointer and set a watchpoint:
(gdb) info registers sp
sp             0xfffffffff290      0xfffffffff290
(gdb) watch *(long long *)0xfffffffff2d8
Hardware watchpoint 2: *(long long *)0xfffffffff2d8
Continue:
(gdb) continue
Continuing.

Hardware watchpoint 2: *(long long *)0xfffffffff2d8

Old value = 281474840286680
New value = 0
0x0000aaaaaaaa0c5c in main ()
Locate that address in iaito. We can see that at 0x00000c58 (the instruction before 0x00000c5c), var_48h is cleared by a str.
Proceed further to find out where the variable is set:
(gdb) continue
Continuing.

Hardware watchpoint 2: *(long long *)0xfffffffff2d8

Old value = 0
New value = 187649984565920
0x0000aaaaaaaa1358 in initialize_framebuffer ()
We can see a new function we have not yet explored: initialize_framebuffer.
In iaito, go to that function:
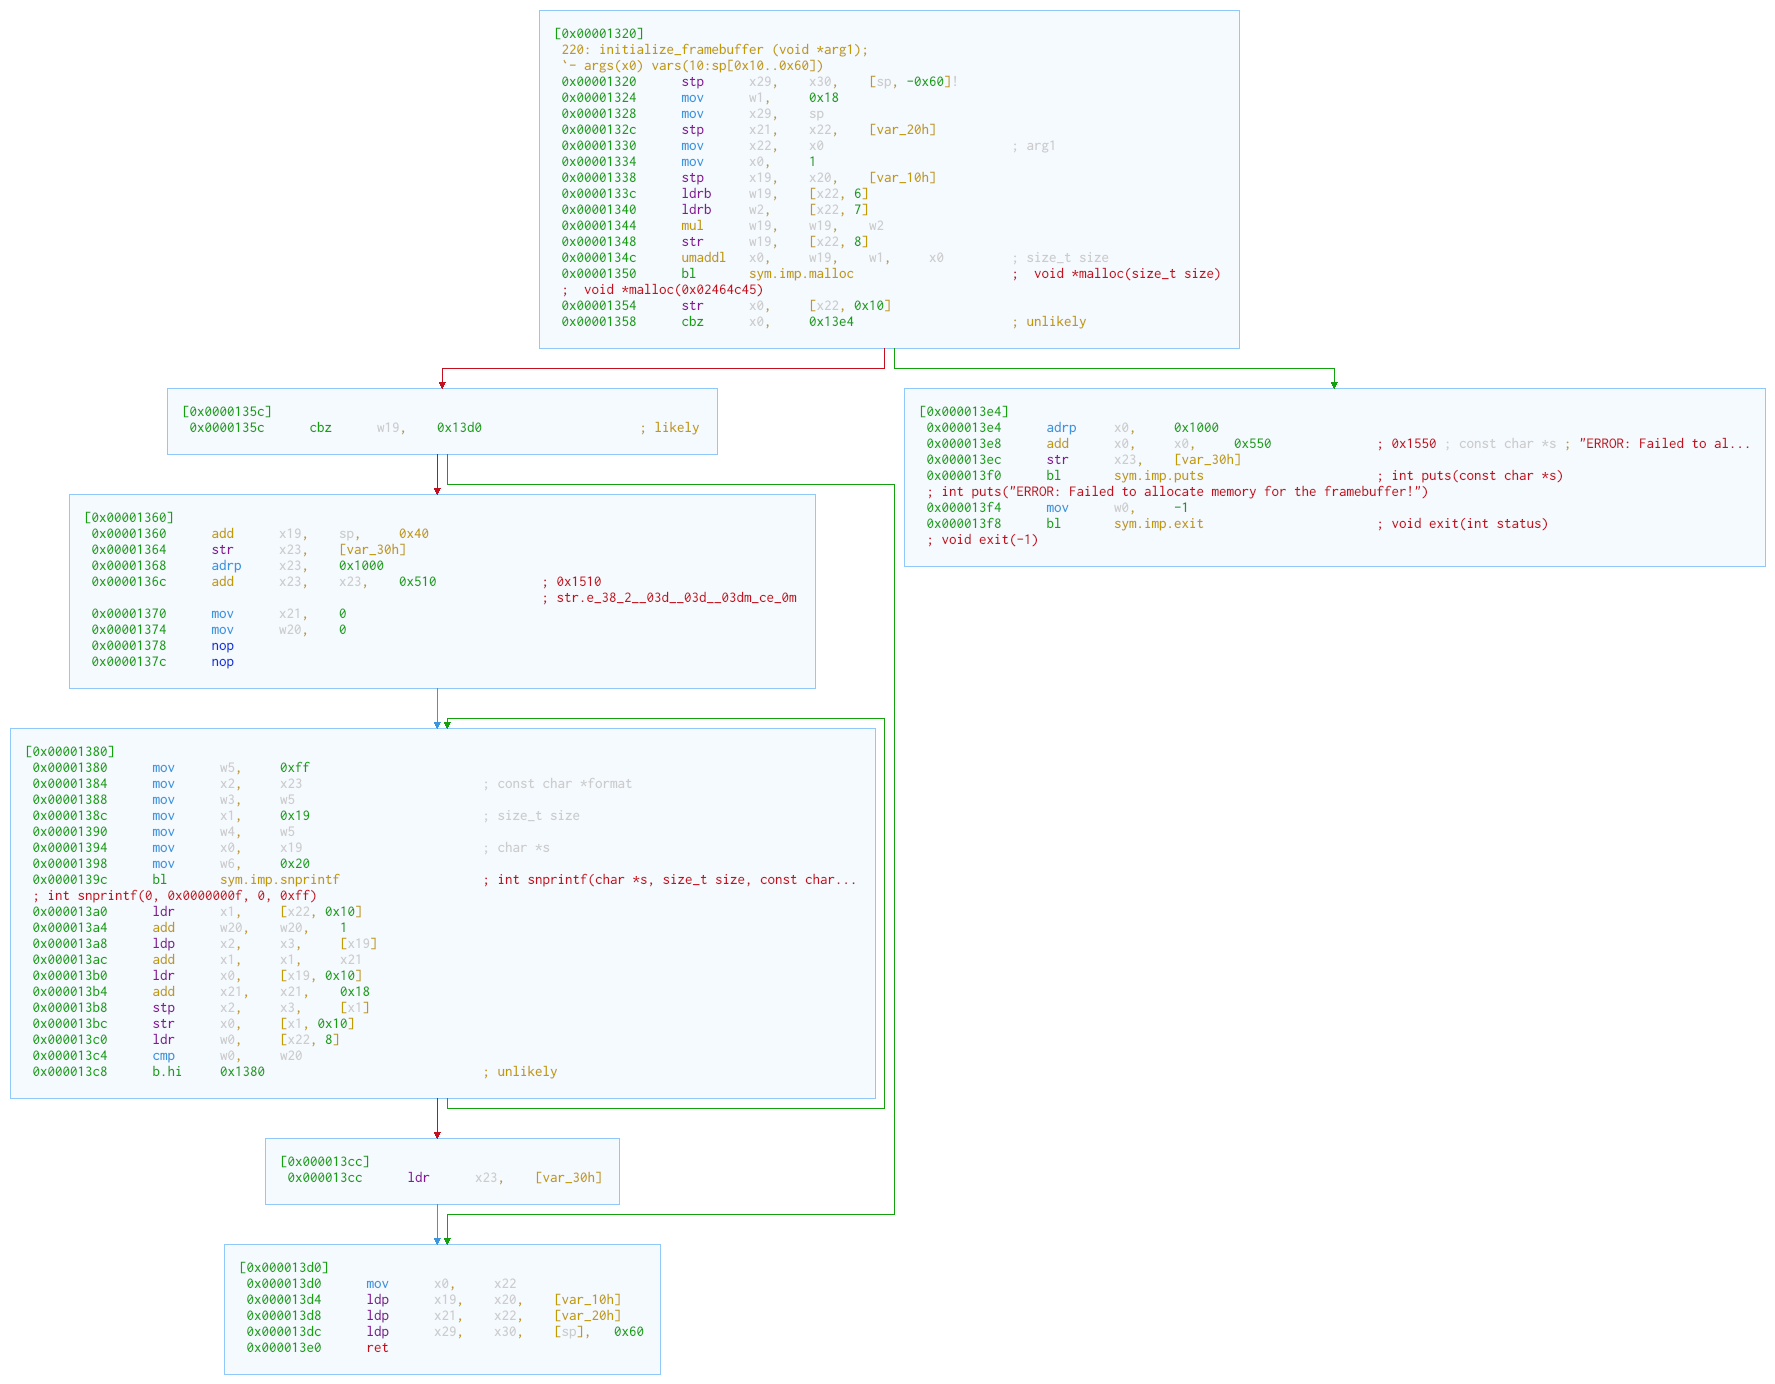
We can see that a memory address allocated by malloc is stored in the variable by the instruction at 0x00001354. However, it is represented as [x22, 0x10]. Let’s check the content of x22:
(gdb) info registers $x22
x22            0xfffffffff2c8      281474976707272
0xfffffffff2c8 + 0x10 = 0xfffffffff2d8. Exactly the address of var_48h.
Additionally, the size passed to malloc is interesting. It is computed by multiplying the values at offsets 6 and 7 together, then multiplying the result by w1, which is 0x18 (24), and then adding x0, which is 1.
Let’s inspect the values at those offsets as well:
(gdb) x/1xb 0xfffffffff2ce
0xfffffffff2ce: 0x0a
(gdb) x/1xb 0xfffffffff2cf
0xfffffffff2cf: 0x0a
Both are 10. They seem to be the image width and height we specified. Let’s check by setting hardware watchpoints. Since AArch64 requires alignment, let’s set the hardware watchpoint at 0xfffffffff2cc:
(gdb) watch *(unsigned int *)0xfffffffff2cc
Hardware watchpoint 1: *(unsigned int *)0xfffffffff2cc
(gdb) run
Starting program: /home/user/challenge ./example.cimg
Skip the GNU C Library triggers:
Hardware watchpoint 1: *(unsigned int *)0xfffffffff2cc

Old value = 0
New value = 65535
0x0000fffff7fccd08 in ?? () from /lib/ld-linux-aarch64.so.1
(gdb) continue
Continuing.

Hardware watchpoint 1: *(unsigned int *)0xfffffffff2cc

Old value = 65535
New value = 0
0x0000fffff7fd5668 in ?? () from /lib/ld-linux-aarch64.so.1
(gdb) continue
Continuing.
[Thread debugging using libthread_db enabled]
Using host libthread_db library "/lib/aarch64-linux-gnu/libthread_db.so.1".

Hardware watchpoint 1: *(unsigned int *)0xfffffffff2cc

Old value = 0
New value = 65535
0x0000fffff7fcc3a4 in ?? () from /lib/ld-linux-aarch64.so.1
(gdb) continue
Continuing.
Here we see that the memory is cleared at 0x00000c54:
Hardware watchpoint 1: *(unsigned int *)0xfffffffff2cc

Old value = 65535
New value = 0
0x0000aaaaaaaa0c58 in main ()
We see a stp xzr, xzr, [buf]. From the afv above, we know buf is 0x38 from the stack pointer.
At 0x00000cb8 we can find a ldr from buf, and then a magic number check.
At 0x00000c9c we can find something interesting:
0x00000c9c      add      x21,    sp,     0x38
0x00000ca0      mov      x2,     8                          ; size_t nbyte
0x00000ca4      mov      x1,     x21                        ; void *buf
0x00000ca8      mov      w0,     0
0x00000cac      bl       sym.imp.read                       ; ssize_t read(int fildes, void *buf, size_t nbyte)
; ssize_t read(0, 0x0000000000000000, 0x00000000)
Therefore, we have confirmed that the two values at those offsets are the width and the height.
Go back to the initialize_framebuffer function in both iaito and GDB. Set a watchpoint and inspect the memory:
(gdb) break *0xaaaaaaaa1354
Breakpoint 1 at 0xaaaaaaaa1354
(gdb) run
Starting program: /home/user/challenge ./example.cimg
[Thread debugging using libthread_db library "/lib/aarch64-linux-gnu/libthread_db.so.1].

Breakpoint 1, 0x0000aaaaaaaa1354 in initialize_framebuffer ()
(gdb) info registers x0
x0             0xaaaaaaac12a0      187649984565920
(gdb) watch *(char *)0xaaaaaaac12a0
Hardware watchpoint 2: *(char *)0xaaaaaaac12a0
(gdb) continue
Continuing.

Hardware watchpoint 2: *(char *)0xaaaaaaac12a0

Old value = 0 '\000'
New value = 27 '\033'
0x0000aaaaaaaa13bc in initialize_framebuffer ()
(gdb) x/24xb 0xaaaaaaac12a0
0xaaaaaaac12a0: 0x1b    0x5b    0x33    0x38    0x3b    0x32    0x3b    0x32
0xaaaaaaac12a8: 0x35    0x35    0x3b    0x32    0x35    0x35    0x3b    0x32
0xaaaaaaac12b0: 0x00    0x00    0x00    0x00    0x00    0x00    0x00    0x00
Compare that with the data above:
(gdb) x/24xb $x0
0xaaaaaaac12a0: 0x1b    0x5b    0x33    0x38    0x3b    0x32    0x3b    0x30
0xaaaaaaac12a8: 0x38    0x30    0x3b    0x30    0x38    0x30    0x3b    0x30
0xaaaaaaac12b0: 0x38    0x30    0x6d    0x50    0x1b    0x5b    0x30    0x6d
0xaaaaaaac12a7 is the first byte that differs. We can set up a watchpoint:
(gdb) watch *(char *)0xaaaaaaac12a7
Hardware watchpoint 3: *(char *)0xaaaaaaac12a7
(gdb) continue
Continuing.

Hardware watchpoint 3: *(char *)0xaaaaaaac12a7

Old value = 50 '2'
New value = 48 '0'
0x0000aaaaaaaa128c in display ()
A new function to explore. Open it in iaito.
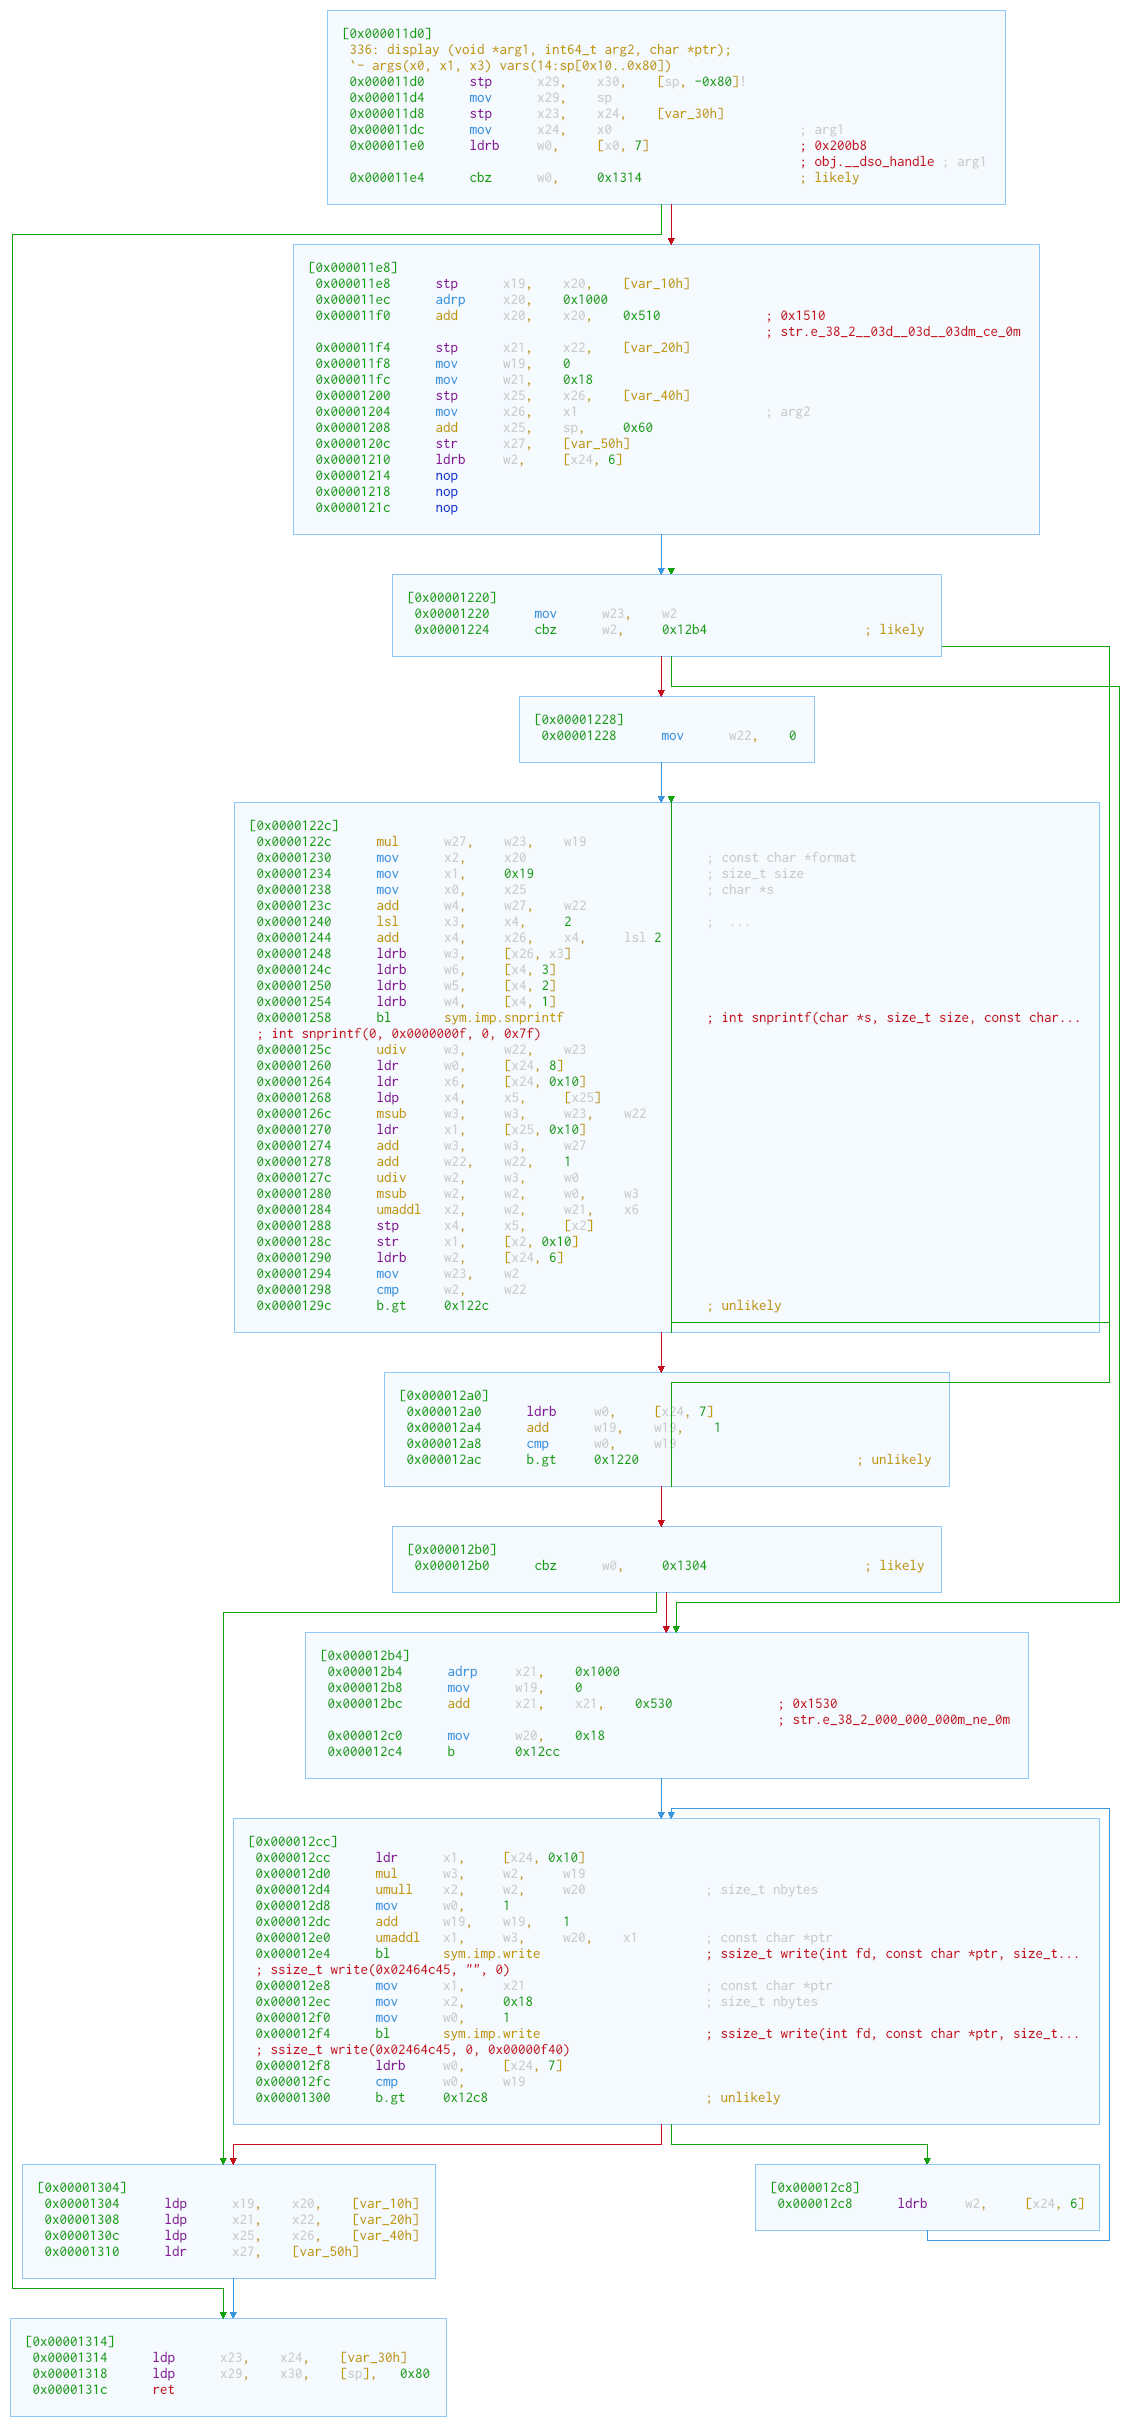
We can see the data change taking place at 0x00001288, in a stp instruction. The str instruction at 0x0000128c is interesting as well; let’s inspect the memory here:
(gdb) x/24xb 0xaaaaaaac12a0
0xaaaaaaac12a0: 0x1b    0x5b    0x33    0x38    0x3b    0x32    0x3b    0x30
0xaaaaaaac12a8: 0x38    0x30    0x3b    0x30    0x38    0x30    0x3b    0x30
0xaaaaaaac12b0: 0x35    0x35    0x6d    0x20    0x1b    0x5b    0x30    0x6d
(gdb) si
0x0000aaaaaaaa1290 in display ()
(gdb) x/24xb 0xaaaaaaac12a0
0xaaaaaaac12a0: 0x1b    0x5b    0x33    0x38    0x3b    0x32    0x3b    0x30
0xaaaaaaac12a8: 0x38    0x30    0x3b    0x30    0x38    0x30    0x3b    0x30
0xaaaaaaac12b0: 0x38    0x30    0x6d    0x50    0x1b    0x5b    0x30    0x6d
The 8-byte block from 0xaaaaaaac12b0 has been changed by the str instruction. The register tells the story:
(gdb) info registers x2
x2             0xaaaaaaac12a0      187649984565920
We do not need to care about x2 too much. Let’s focus on x4, x5, and x1. At 0x00001268 and 0x00001270 we see a very important register, x25. It contains the address of the memory holding the data written to the memory located by x2. Inspect that memory:
(gdb) x/24xb $x25
0xfffffffff270: 0x1b    0x5b    0x33    0x38    0x3b    0x32    0x3b    0x30
0xfffffffff278: 0x38    0x30    0x3b    0x30    0x38    0x30    0x3b    0x30
0xfffffffff280: 0x38    0x30    0x6d    0x50    0x1b    0x5b    0x30    0x6d
At 0x00001238, the address in x25 is copied to x0. Then pieces of data are copied to the following registers. Then there is a call to snprintf. snprintf writes formatted output to a character array:
int snprintf(char *str, size_t size, const char *format, ...);
It is writing a formatted string to the memory at x25. Let’s restart GDB and inspect the memory pointed to by x2:
(gdb) break *0xaaaaaaaa1258
Breakpoint 1 at 0xaaaaaaaa1258
(gdb) run
Starting program: /home/user/challenge ./example.cimg
[Thread debugging using libthread_db library "/lib/aarch64-linux-gnu/libthread_db.so.1].

Breakpoint 1, 0x0000aaaaaaaa1258 in display ()
(gdb) x/s $x2
0xaaaaaaaa1510: "\033[38;2;%03d;%03d;%03dm%c\033[0m"
(gdb) x/29xb $x2
0xaaaaaaaa1510: 0x1b    0x5b    0x33    0x38    0x3b    0x32    0x3b    0x25
0xaaaaaaaa1518: 0x30    0x33    0x64    0x3b    0x25    0x30    0x33    0x64
0xaaaaaaaa1520: 0x3b    0x25    0x30    0x33    0x64    0x6d    0x25    0x63
0xaaaaaaaa1528: 0x1b    0x5b    0x30    0x6d    0x00
This is the string format. If you are not comfortable with the string returned by x/s, you can use Python to print the string byte by byte:
>>> print(b"\x1b\x5b\x33\x38\x3b\x32\x3b\x25\x30\x33\x64\x3b\x25\x30\x33\x64\x3\
b\x25\x30\x33\x64\x6d\x25\x63\x1b\x5b\x30\x6d\x00")
b'\x1b[38;2;%03d;%03d;%03dm%c\x1b[0m\x00'
>>> blob = b'\x1b[38;2;%03d;%03d;%03dm%c\x1b[0m\x00'
>>> for i1 in range(len(blob)):
...     blob[i1:i1+1]
...
b'\x1b'
b'['
b'3'
b'8'
b';'
b'2'
b';'
b'%'
b'0'
b'3'
b'd'
b';'
b'%'
b'0'
b'3'
b'd'
b';'
b'%'
b'0'
b'3'
b'd'
b'm'
b'%'
b'c'
b'\x1b'
b'['
b'0'
b'm'
b'\x00'
This format string has four placeholders. The first three are %03d, which formats an integer as a decimal string containing at least three digits (for example, 7 becomes 007, and 15 becomes 015). The last one is %c, which matches just one character.
Now we have the byte pattern:
0x1b    0x5b    0x33    0x38    0x3b    0x32    0x3b    [N1]
[N1]    [N1]    0x3b    [N2]    [N2]    [N2]    0x3b    [N3]
[N3]    [N3]    0x6d    [CH]    0x1b    0x5b    0x30    0x6d
We can now inspect what fills the placeholders:
(gdb) info registers x3 x4 x5 x6
x3             0x50                80
x4             0x50                80
x5             0x50                80
x6             0x50                80
All 0x50, which seems to be the data we use in the example cIMG. Now let’s recreate the cIMG to make that clearer:
>>> with open("example.cimg", "wb") as file:
...     file.write(b"cIMG\x02\0\x0a\x0a\x12\x34\x56\x78")
...     file.write(b"\x50"*(10*10*4-4))
...
12
396
(gdb) break *0xaaaaaaaa1258
Breakpoint 1 at 0xaaaaaaaa1258
(gdb) run
Starting program: /home/user/challenge ./example.cimg
[Thread debugging using libthread_db library "/lib/aarch64-linux-gnu/libthread_db.so.1].

Breakpoint 1, 0x0000aaaaaaaa1258 in display ()
(gdb) info registers x3 x4 x5 x6
x3             0x12                18
x4             0x34                52
x5             0x56                86
x6             0x78                120
Thus, the N1, N2, and N3 in the hex pattern above correspond to R, G, and B respectively, and CH is just the character we are trying to fill in.
Now we can go back to GDB, break before each memcmp, run x/24xb $x1 to find out the expected framebuffers, and use those framebuffers to recover the expected cIMG data. Then fill in the data using a hex editor.
Size check
However, after filling in the expected data, the executable still does not give us the flag. After using GDB to inspect the memory, we can see that the memcmps are returning zeros as expected. Therefore, there must be other conditions that are not fulfilled.
Go back to iaito and scroll backwards from the first memcmp. We can see a cmp at 0x00000d60 that compares var_40h with 4. At 0x00001348 in initialize_framebuffer we can find a str that stores the product of the width and the height.
The cmp at 0x00000d60 then decides the value of w0. If var_40h equals 4, w0 will become 1; otherwise, it will become 0.
At 0x00000d78 w0 is compared with 0, which affects the behaviour of the ccmp instruction at 0x00000d84. The content of [x22, 0x13] is loaded into the w0 register, and [x1, 0x13] is loaded into w2. According to the memcmp, we can easily tell that x22 is the actual framebuffer address, and x1 is the expected framebuffer address. Given that we have already made the data the same as expected, and offset 19 is an ASCII character, w0 and w2 should be the same and should be non-zero.
We can conclude that if var_40h equals 4, w2 will be compared against w0, which will set w19 to 1. Otherwise, w2 will be compared against 0, rendering w19 zero.
After the first memcmp, w19 will be compared against 0 since w0 equals zero at 0x00000e7c. Then cset will set w19 to 1 if not equal, otherwise to 0.
Now alter the cIMG with a hex editor, changing the height and the width to values that multiply to 4. For example, we can set 0202. Now the executable should give us the flag.
Conclusion
The procedure above involves:
- static analysis with radare2 and iaito;
-
dynamic analysis with GDB involving:
-
control-flow tampering;
- memory inspection;
- integer inspection.
This is a very typical procedure in reverse engineering.
By the way, there may be other approaches to reverse this executable. However, no matter what approach is used, it usually involves both static analysis and dynamic analysis.